The original question
How do formal non-cooperative game theory frameworks—such as Nash equilibrium, Cournot-Bertrand oligopoly models, dynamic extensive-form games, and mechanism design—apply to corporate business strategy, market entry deterrence, and competitive pricing decisions? How are strategic interactions modeled to predict competitor payoffs and sustain first-mover advantages?
1. Introduction to Non-Cooperative Game Theory in Corporate Strategy
Non-cooperative game theory provides a rigorous analytical framework for modeling strategic interactions among firms in imperfectly competitive markets, particularly oligopolies where a small number of firms influence market outcomes. As described in the supplied analyst report, game theory studies how economic actors choose strategies considering the anticipated responses of rivals (Mankiw, Principles of Economics, packets 1–3). The Nash equilibrium concept captures stable strategy profiles where no firm benefits from unilateral deviation, serving as the foundational solution concept for oligopoly analysis (Horowitz, New Dictionary of the History of Ideas, packets 8–9). This framework underpins corporate decisions on pricing, output, capacity investment, advertising, and research and development (R&D).
2. Static Oligopoly Models: Cournot and Bertrand Competition
Mathematical notation in this section is an explanatory formalization drawn from the analyst report, not a verified transcription from a primary source. Its conclusions depend on the stated model assumptions.
The classical static oligopoly models distinguish between quantity competition (Cournot) and price competition (Bertrand). In the Cournot duopoly with linear inverse demand $P(Q) = a - bQ$ and constant marginal cost $c$, each firm chooses output $q_i$ to maximize profit:
$$ \pi_i(q_i, q_j) = (a - b(q_i + q_j) - c) q_i $$
The reaction function for firm $i$ is:
$$ q_i = \frac{a - c - b q_j}{2b} $$
Symmetric equilibrium quantities and prices are:
$$ q^* = \frac{a - c}{3b}, \quad Q^* = \frac{2(a - c)}{3b}, \quad P^* = \frac{a + 2c}{3} $$
with equilibrium profits:
$$ \pi_i^* = \frac{(a - c)^2}{9b} > 0 $$
In contrast, the Bertrand model assumes firms simultaneously set prices $p_i$ for homogeneous goods with identical marginal costs $c$. Consumers buy from the lowest-priced firm, leading to the unique Nash equilibrium:
$$ p_1^* = p_2^* = c, \quad \pi_1^* = \pi_2^* = 0 $$
This is the Bertrand paradox, where price competition erodes economic profits despite few competitors (Mankiw, packets 1–3; Horowitz, packets 8–9).
| Model | Strategic Variable | Equilibrium Price | Equilibrium Profit | Market Power |
|---|---|---|---|---|
| Cournot Duopoly | Quantity $q_i$ | $P^* = \frac{a + 2c}{3} > c$ | $\pi_i^* = \frac{(a - c)^2}{9b} > 0$ | Positive markup |
| Bertrand Duopoly (Homogeneous) | Price $p_i$ | $P^* = c$ | $\pi_i^* = 0$ | Zero markup |
These models provide benchmark predictions for pricing and output decisions under specific assumptions about product homogeneity and cost structures.
3. Dynamic Extensive-Form Games and First-Mover Advantages
Mathematical notation in this section is an explanatory formalization drawn from the analyst report, not a verified transcription from a primary source. Its conclusions depend on the stated model assumptions.
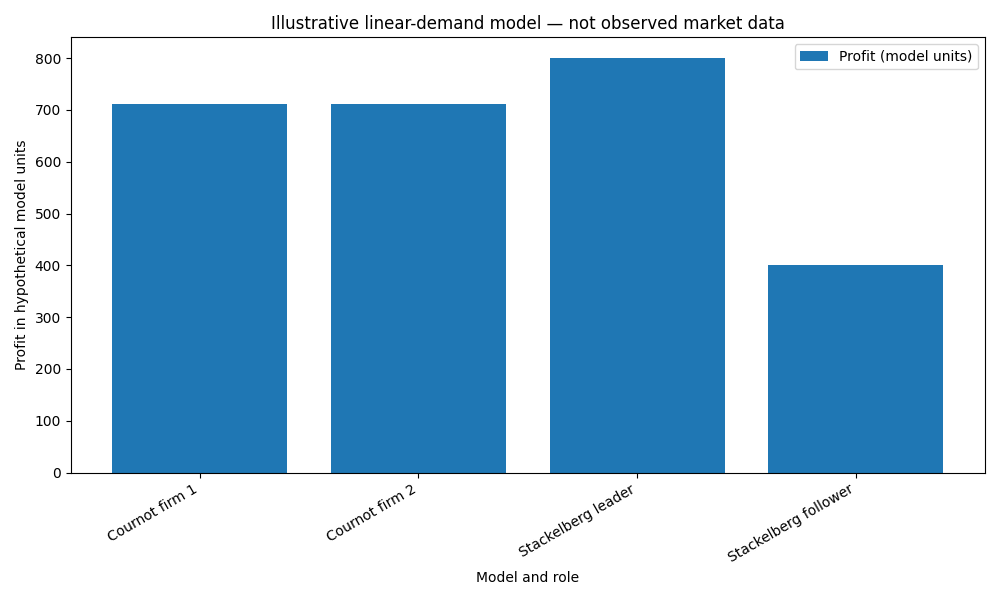
Dynamic games model sequential decision-making where firms observe prior moves before acting. The Stackelberg leadership model exemplifies this, with a leader firm committing to output $q_1$ first, and a follower responding with $q_2$:
$$ q_2 = \frac{a - c - b q_1}{2b} $$
The leader maximizes:
$$ \pi_1(q_1) = (a - b(q_1 + q_2) - c) q_1 = \left( \frac{a - c - b q_1}{2} \right) q_1 $$
Solving yields equilibrium quantities and profits:
$$ q_1^* = \frac{a - c}{2b}, \quad q_2^* = \frac{a - c}{4b}, \quad P^* = \frac{a + 3c}{4} $$
$$ \pi_1^* = \frac{(a - c)^2}{8b} > \frac{(a - c)^2}{9b} = \pi_i^{Cournot} $$
indicating a potential first-mover advantage by preempting follower output (Mankiw, Horowitz, packets 1–3, 8–9).
However, the evidence explicitly cautions that first-mover advantages are not universal. The leader's profit superiority depends on the functional forms of demand and cost; alternative specifications may yield no advantage or even a disadvantage (file4_3_of_8.pdf, packet 7). Thus, first-mover benefits are structural and contingent, not guaranteed.
Dynamic extensive-form games also model market entry deterrence. The Dixit-Spence framework formalizes how an incumbent's irreversible capacity investment $K_1$ before entry can credibly deter entrants by lowering post-entry profits below entry costs $F$:
$$ \pi_E^*(K_1) - F < 0 $$
where $\pi_E^*(K_1)$ is the entrant's post-entry profit given incumbent capacity. This credible threat influences entry decisions and sustains incumbent market power (Horowitz, businessssssssss.pdf, packets 4, 7, 8).
The sequential nature of these games is solved via Subgame Perfect Nash Equilibrium (SPNE) using backward induction, ensuring credible strategies at every stage.
4. Mechanism Design and Strategic Information Economics
Mathematical notation in this section is an explanatory formalization drawn from the analyst report, not a verified transcription from a primary source. Its conclusions depend on the stated model assumptions.
Mechanism design, or "reverse game theory," constructs rules and payoff structures to induce desired strategic behavior under private information. Applications include auctions and contract screening.
For example, in sealed-bid second-price (Vickrey) auctions, bidding one's true valuation $v_i$ is a weakly dominant strategy:
$$ u_i(v_i, b_{-i}) \ge u_i(b_i, b_{-i}) \quad \forall b_i \neq v_i $$
where $b_i$ is a bid and $b_{-i}$ bids of others (businessssssssss.pdf, packet 4).
In nonlinear pricing and screening, firms design incentive-compatible (IC) and individually rational (IR) contracts to elicit truthful revelation of buyer types $\theta \in \{\theta_L, \theta_H\}$:
$$ \theta_H u(q_H) - T_H \ge \theta_H u(q_L) - T_L \quad (IC_H) $$
$$ \theta_L u(q_L) - T_L \ge 0 \quad (IR_L) $$
where $q_i$ and $T_i$ are quantity and transfer for type $i$ (businessssssssss.pdf, packet 4).
While the evidence presents these frameworks theoretically, explicit mappings to corporate pricing or entry strategies require specifying the information environment and strategic objectives. Mechanism design enriches the strategic toolkit when asymmetric information and incentive alignment are central.
5. Modeling Strategic Interactions and Predicting Competitor Payoffs
Strategic interactions are modeled by defining each firm's payoff function $u_i(s_i, s_{-i})$, where $s_i$ is firm $i$'s strategy and $s_{-i}$ the profile of rivals' strategies. Firms anticipate rivals' responses and choose best responses accordingly, leading to equilibrium concepts such as Nash equilibrium or SPNE.
Predicting competitor payoffs involves:
- Specifying demand and cost functions to determine market prices and quantities.
- Modeling timing and information structure (simultaneous vs sequential moves).
- Incorporating commitment devices (capacity investments, contracts).
- Accounting for private information via mechanism design.
The equilibrium analysis yields stable strategy profiles and associated payoffs, enabling firms to evaluate the profitability of strategic options and the sustainability of competitive advantages.
However, the evidence emphasizes that equilibrium outcomes are benchmark solutions contingent on assumptions of rationality, common knowledge, and functional forms. Real-world deviations due to bounded rationality, incomplete information, or regulatory constraints may alter payoffs and strategic dynamics (Horowitz, file4_3_of_8.pdf, packets 7–9).
6. First-Mover Advantages: Structural Conditions and Limitations
First-mover advantages arise when a firm's early action credibly constrains rivals' responses or leverages irreversible investments, network effects, or learning-by-doing. The evidence identifies key determinants:
- Irreversible commitments such as sunk capacity investments.
- Network externalities increasing consumer switching costs.
- Learning effects reducing future marginal costs.
However, first-mover advantages are not guaranteed. The evidence explicitly states that moving first "need not produce higher profit" and depends on the specific functional forms of demand and cost (file4_3_of_8.pdf, packet 7). Followers may free-ride on R&D or benefit from improved information, potentially reversing advantages.
Therefore, firms must carefully assess market conditions and structural parameters before relying on first-mover strategies. The Stackelberg leadership model provides a useful but conditional benchmark for such analysis.
7. Practical Implications for Corporate Strategy
The formal non-cooperative game theory frameworks provide a structured approach to corporate strategy by:
- Offering benchmark models (Cournot, Bertrand) to anticipate pricing and output equilibria under different market structures.
- Enabling analysis of sequential moves and commitment effects through dynamic games (Stackelberg, entry deterrence).
- Informing contract and auction design via mechanism design to manage asymmetric information.
Practitioners should:
- Specify market parameters (demand elasticity, cost functions, product differentiation) to select appropriate models.
- Recognize that equilibrium outcomes are contingent on assumptions and serve as structured expectations rather than guaranteed predictions.
- Use comparative statics and sensitivity analysis to test robustness of strategic plans.
- Consider information asymmetries and design incentive-compatible mechanisms when relevant.
This approach facilitates rigorous evaluation of competitive pricing, capacity investment, entry deterrence, and contract design decisions, improving strategic foresight and decision quality.
Figures & models
Reading guide
Illustrative model — not empirical data